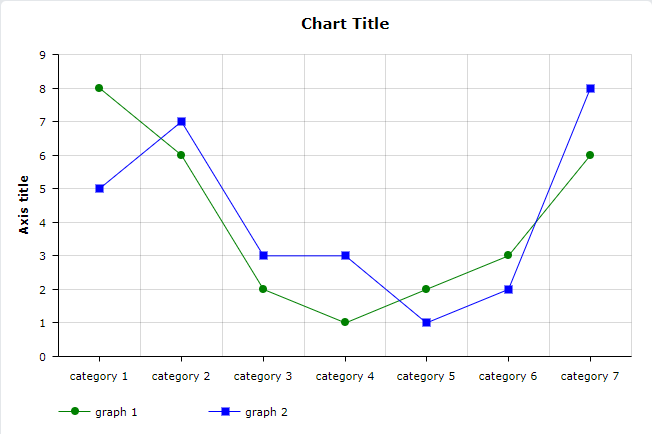
Como alterar cor de linha, no grafico feito no amchart?
Você pode alterar a cor da linha informando a propriedade "lineColor": "Color".
Neste exemplo, estou especificando as cores “Green” e “Blue” para as linhas:
{
	"type": "serial",
	"categoryField": "category",
	"startDuration": 1,
	"categoryAxis": {
		"gridPosition": "start"
	},
	"trendLines": [],
	"graphs": [
		{
			"balloonText": "[[title]] of [[category]]:[[value]]",
			"bullet": "round",
			"id": "AmGraph-1",
			"title": "graph 1",
			"valueField": "column-1",
                        "lineColor": "Green"
		},
		{
			"balloonText": "[[title]] of [[category]]:[[value]]",
			"bullet": "square",
			"id": "AmGraph-2",
			"title": "graph 2",
			"valueField": "column-2",
                        "lineColor": "Blue"
		}
	],
	"guides": [],
	"valueAxes": [
		{
			"id": "ValueAxis-1",
			"title": "Axis title"
		}
	],
	"allLabels": [],
	"balloon": {},
	"legend": {
		"enabled": true,
		"useGraphSettings": true
	},
	"titles": [
		{
			"id": "Title-1",
			"size": 15,
			"text": "Chart Title"
		}
	],
	"dataProvider": [
		{
			"category": "category 1",
			"column-1": 8,
			"column-2": 5
		},
		{
			"category": "category 2",
			"column-1": 6,
			"column-2": 7
		},
		{
			"category": "category 3",
			"column-1": 2,
			"column-2": 3
		},
		{
			"category": "category 4",
			"column-1": 1,
			"column-2": 3
		},
		{
			"category": "category 5",
			"column-1": 2,
			"column-2": 1
		},
		{
			"category": "category 6",
			"column-1": 3,
			"column-2": 2
		},
		{
			"category": "category 7",
			"column-1": 6,
			"column-2": 8
		}
	]
}
Você pode usar a página https://live.amcharts.com/ para testar.